Overview instruments

9001 SPM

Multifunction Meter for Optical Quantities

with Visual Instrumentation®

Spectrometer 9001

* for wavelengths of 310 nm up to greater than 1000 nm with a resolution of 256 pixel.
* Signal input with fiber optics cable,thus very versatile
* Color measurements with normalized tristimulus values and display of color spectrum
* Layer thickness measurement for transparent layers in the range from 0.3 æm on to 20 æm
* 3D display of up to 10 spectra in graphic screen and hard copy to a printer, storage capacity of more than 100 spectra in the instrument.
Spectroscopy Layer Thickness Measurements Process Control Optical Specifications

Spectroscopy

Optical Measurements made easy

If your task is to make emission, transmission or reflectivity measurements the SPM 9001 is the ideal instrument.
Some examples for applications are the measurement of the light spectrum of bulbs or LED’s, absorption measurements of fluids, measurement of optical filters and much more.
Spectrum of an energy saving lamp

Taking Data without the Necessity for a PC

The instrument has a very compact size compared to other spectrometers. This allows the use in many applications.
The light is fed to the instrument via glass fibers. There is a halogen lamp integrated in the instrument which allows reflection or transmission measurements without an additional light source.
The SPM 9001 uses a solid diode array module which guarantees an excellent wavelength stability and a very small temperature drift.

Visual Instrumentation®

The result of a measurement is plotted directly on the internal LC display. Two independent cursors make it possible to analyze the data online. The wavelength as well as the relative intensity are shown on the display. This way peaks can be attributed fast and easy. The ratio of the intensity at the cursor positions is also plotted on the screen, even the area under the curve between the two cursors is shown.

3-D-Plots

Are you interested in spectra which change in time? Then make use of the 3-D plots (see figure). Up to 10 spectra can be plotted parallel on the screen. This makes it easy to see immediately, where new peaks in the spectrum appear and disappear.

 
3D-View of 20 spectra

Time View

You can use a Time View plot to visualize the change of the intensities at the two cursor positions. The Time View makes it easy to see changes

Online Help

The Online Help will give you an immediate Help about the measurement functions you use.
Online Help-Menu

Data Transfer Made Easy

The results of your measurement can be stored on the internal hard drive of the instrument. They can be transferred to a computer via the RS232 interface for further analyzing.
A Windows software for the data transfer from the SPM 9001 to a PC is available on request.
The SPM 9001 is equipped with a serial interface for data transfer. Additionally a complete control via the RS232 interface by an external computer is possible. This means the instrument can also be used in a system.
 
 Accessories:
 glass fibers for different applications
 measuring module for transmission measurements
 5029/9001 Windows-Software PREMA-Control for data transfer to a PC
 additional accessories available on request
Top of Page

Layer Thickness Measurements

Thickness Measurements of a Transparent Layer

The SPM 9001 is a high precision instrument for the determination of layer thicknesses.
Examples for applications are determination of the layer thicknesses of photo resists on semiconductor wafers and coatings on glass bottles.

Contactless Measurements

Since an optical detection method is used, the measurement is contactless and will not destroy the film. The light is fed in to the instrument by a glassfiber, this way it is possible to measure films where they are difficult to access.

Measurements with High Spatial Resolution

The size of the light spot is determined by the optical system which is used. Usually a y-fiber can be used. In this case the spot size is approximately 1mm. If it is necessary to increase the spatial resolution the glassfiber can be connected to the photo connector of a light microscope.

No Additional Instrumentation Necessary

The SPM 9001 works as a stand-alone instrument. No additional PC for controlling is necessary. The instrument is equipped with an internal light source. There is no need for an additional lamp or power source. They data can be analyzed directly on the display. Data can be stored in the instrument or plotted directly to an external printer. The instrument can even be used for controlling purposes since it has an TTL output. The alarm function of the instrument allows it to set an alarm if an actual thickness is above or below a set point.
 
 
The interference spectrum 


The thickness is shown on the display of the instrument - 
in numbers (left) and graphically (right)

The Principle of the Measurement

White light is reflected at the surface of the film and on the surface of the layer.
Depending on the wavelength of the light constructive or destructive interference will occur. The thickness of the film can be calculated from the interference spectrum with a fourier analysis method if the refracting index of the film is known.
 
 Accessories:
 9024 Y-fiber with FSMA adapter and cylindric head
 9025 layer thickness measuring adapter
 
Top of Page

Process Control

Do you need an instrument for controlling processes depending on a changing optical signal? Then the SPM 9001 should be the instrument of your choice. An important application can be found in the semiconductor industry. The SPM 9001 is used as controlling unit for endpoint detection. But the field of application is larger. Everywhere, where you have changing optical signals (e.g. a change in the emitted, transmitted or reflected light), you can use this instrument as a control unit.

End Point Detection for Plasma Etching Processes

The SPM 9001 is an ideal instrument for detecting the end point of a plasma etching process. In this application the fact is used that the light spectrum of the plasma changes depending of the development of the process. In the plasma spectrum sharp lines are detected which can be attributed to the chemical elements involved in the etching process. The intensity of these lines will change during the etching process. These changes are detcted by the SPM 9001. If the intensity of a line drops under a certain value (which is given by the user), or if the ratio between two lines is bigger or smaller than a given value the process is finished and an output is set.

Example:
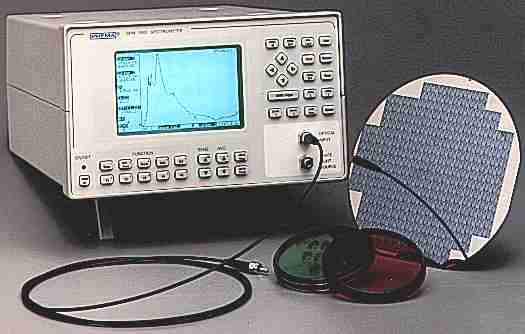
Endpoint detection of a Plasma etching process, where a photoresist is removed from a silicon wafer.

 
  Figure 1 shows the spectrum of a plasma for the dry etching of a photoresist during the etching process. The strong emission line at 656 nm belongs to hydrogen, which is released during the etching process. 
 
  During the etching process a decrease of the hydrogen line and an increase of a line at 777 nm (which is due to the etching agent oxygen) is observed. Figure 3 shows the spectrum after the etching process is completed. Here the oxygen line is dominant.
 
  The time dependency of the two strongest lines (hydrogen (1) and oxygen (2)) is shown in figure 3. After the two curves have reached the crossing point the etching process can be finished (after an additional, process dependent delay). 

Process Control possible without additional PC

The SPM 9001 can be used without an additional PC. The measurement can be triggered via the trigger input on the rear side of the instrument. There is a TTL output which is also located on the rear side. 4 different conditions of the instrument are indicated by the TTL output.
Functions
Different event conditions can be selected
Change between Real Time mode and Time View (the changes of the intensities at two wavelengths is shown)
Periodical View (up to 20 spectra are plotted on the display)
Trigger input and output
Rear Input Panel Connectors (optional)
RS232 and Centronics interface
 
Top of Page

Optical Specifications

 
Available 
Models
VIS-1 
SPM 9001-250 
UV-VIS-1 
SPM 9001-240 
VIS-NIR-1 
SPM 9001-260 
UV-VIS-2 
SPM 9001-230 
UV-1 
SPM 9001-220 
Wavelength [nm]  305-1100  305-1100  305-1100  190-735  200-400 
specified  360-900  305-900  400-1150  220-735  220-400 
Number of Pixels  256  256  256  256  256 
Distance [nm]  3.3  3.3  3.3  2.2  0.8 
Accuracy absolute 
[nm] 
0.3  0.3  0.3  0.2  0.2 
relative [nm]  0.1  0.1  0.1  0.1  0.1 
Temp.-Drift [nm/°C]  0.02  0.02  0.02  0.006  0.006 
Resolution [nm]  10  10  10 
Scattering light  0.1%  0.1%  0.1%  0.1%  0.1% 
Resolution Y-Axis  15 bit  15 bit  15 bit  15 bit  15 bit 
Sensitivity 
[Counts/Ws] 
10^13  10^13  0,5·10^13  0,5·10^13  10^12 
at wavelength [nm]  600  600  600  480  320 
Grating (Flat-Field)  366 l/nm  366 l/nm  366 l/nm  366 l/nm  1084 l/nm 
blazed for ca.  460 nm  650 nm  380 nm  220 nm  220 nm 
Entrance gap  2.5mm·70µm  2.5mm·70µm  2.5mm·70µm  2.5mm·70µm  1.25mm·70µm 
Integration times, 
selectable 
10.24ms bis 2.62s  10.24ms bis 2.62s  10.24ms bis 2.62s  10.24ms bis 2.62s  10.24ms bis 2.62s 
    interesting for 
color 
measurements 
    interesting for 
color 
measurements 
 
Hardware
Interfaces RS232 for connection to a computer, Centronics for direct printer connection
Connection via fiber optics cable with SMA connector
Internal Light Source halogen lamp, output via fiber optics cable with SMA connector on the front panel
Case stable aluminium case with graphic display (200 x 320 dots) 
H x W x D 140mm (3 HU) x 225 mm (½19'') x 275 mm 
Weight 8 kg / 18 Ibs
Power 230 V ± 10 % or 115 V ± 10 % switchable, 50 or 60 Hz
Options and Accessories Immersion probes, cell holder, additional accessories on request
Warm Up Time 1 h
Safety according EN61010 CE
EMV EN50081, EN55011, EN50082, CE
Environment Temperature 10°C to 45°C in operation, -25°C to 60°C in storage
Humidity < 25°C up to 75 % rel. 
> 25°C up to 65 % rel.
Warranty 2 years
 
literature request
Top of Page

© Copyright 1998 Hönow Messtechnik & Computer. Letzte Revision: 17.03.98. Bearbeiter: OHH

spectrometer PREMA 9001 optical multifunktion meter spektrometry, spectroscope color colour spectrum, layer thickness measurement process control Visual Instrumentation. optics wavelength resolution inpu, signal light guide cabel norm value spektra, transparent 3D-plot screen display spektroskopy measuring instrument, emission transmission reflectivity reflection registrate. lamp bulb LED illumination absorption chemical liquid filter, energy saving glass fiber integrated halogen source. diode array module LCD peak analyze relative intensity successive record, parallel view time serial RS 232 interface. semiconductor industry photo resist, silicon wafer food film plastic bottle medicine technics engineering, contactless destroy white substrate surface interference. reflekted ray Fourier analysis plasma etch endpoint detection, emit transmit, reflect immersion probe.